While descriptive statistics summarize the characteristics of a data set,
inferential statistics help you come to conclusions and make predictions based on your data.
Inferential statistics have two main uses:
making estimatesabout populations (for example, the mean SAT score of all 11th graders in the US).testing hypothesesto draw conclusions about populations (for example, the relationship between SAT scores and family income).
Estimates
It is a specified observed numerical value used to estimane an unknown population parameter
- A statistic is a measure that describes the sample (e.g., sample mean).
- A parameter is a measure that describes the whole population (e.g., population mean).
There are two important types of estimates
- Point estimate
- Interval estimate
A point estimate is a single value estimate of a parameter.
For instance, a sample mean is a point estimate of a population mean
An interval estimate gives you a range of values where the parameter is expected to lie.
A confidence interval is the most common type of interval estimate.
Point extimate along with interval estimate gives min and max range value with some margin of error is called Confidence interval
Hypothesis testing
Inferential stats: conclusion or Infrences
- With the help of sample data make some conclusion about the population data
- i.e make conclusion about some unknown parameters(mean, var etc) of the population data
Hypothesis Testing Mechanism
- Null Hypothesis(H_o)
- The assumption you are begining with
- Alternate Hypothesis(H_a)
- Opposite of null Hypothesis
- Expriments
- Statistical Analysis
P value (probability value)
The p value is a number, calculated from a statistical test, that describes how likely you are to have found a particular set of observations if the null hypothesis were true.
P values are used in hypothesis testing to help decide whether to reject the null hypothesis. The smaller the p value, the more likely you are to reject the null hypothesis.
Statistical Test in Hypothesis Testing
- Z Test
- t Test
- Chi-square
- ANOVA Test
Z Test
Condition for Z test
- Should know population std
- sample size(n) >= 30
Central Limit Theorem
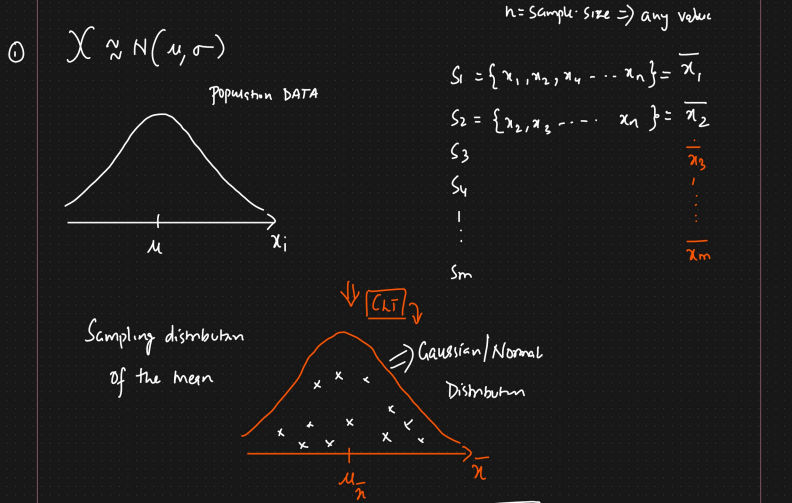
The central limit theorem relies on the concept of a sampling distribution, which is the probability distribution of a statistic
for a large number of samples taken from a population.
The central limit theorem states that if you take sufficiently large samples from a population,
the samples means will be normally distributed, even if the population isn’t normally distributed,
regardless of whether the population has a normal, Poisson, binomial, or any other distribution.

Example:
A population follows a Poisson distribution (left image). If we take 10,000 samples from the population,
each with a sample size of 50, the sample means follow a normal distribution, as predicted by the central limit theorem (right image).
Sample size, Mean and Std
The sample size (n) is the number of observations drawn from the population for each sample.
The larger the sample size, the more closely the sampling distribution will follow a normal distribution.
- When n < 30
- The central limit theorem doesn’t apply
- The sampling distribution will follow a similar distribution to the population.
- Therefore, the sampling distribution
will only be normal if the population is normal.
- When n ≥ 30
- The central limit theorem applies.
- The sampling distribution will approximately
follow a normal distribution.

The mean of the sampling distribution is the mean of the population.
The standard deviation of the sampling distribution is the standard deviation of the population divided by the square root of the sample size.


