📝 Topics Covered
- 1. What is UML?
- 2. Benefits of UML
- 3. Core Types of UML Diagrams
- 4. Class Diagram
- 5. Use Case Diagram
- 6. State Diagram
- 7. Activity Diagram
- 8. Sequence Diagram
- 9. UML vs. ERD
1. What is UML?
A Unified Modeling Language (UML) diagram provides a visual representation of an aspect of a system. UML diagrams illustrate the quantifiable aspects of a system that can be described visually, such as relationships, behavior, structure, and functionality.
The original UML standard specified 9 diagrams; however, UML 2.x has increased that number up to 13 different diagrams to cater to more comprehensive system designs.
2. Benefits of UML
- Accelerated Understanding: Enables developers, architects, and stakeholders to develop a
quick understandingof a codebase or architecture. - Component Deconstruction: Breaks a highly
complex systeminto discrete, manageable pieces. - Effective Communication: Graphical notations provide a standardized language to communicate complex design decisions across teams.
3. Core Types of UML Diagrams
The current UML 2.x standards designate 13 distinct diagram types, which are classified into three primary categories:
3.1 Structural Diagrams
Structural diagrams focus on static aspects of a system, modeling the entities that exist at compile-time:
- Class Diagram: Shows classes, attributes, methods, and relationships.
- Package Diagram: Groups related classes together to manage namespaces and modules.
- Object Diagram: Depicts the static state of instances at a particular moment in time.
- Component Diagram: Displays structural relationships between software components.
- Composite Structure Diagram: Describes the internal structures of a classifier (e.g., a class).
- Deployment Diagram: Models physical hardware infrastructure and execution environments.
3.2 Behavioral Diagrams
Behavioral diagrams focus on dynamic aspects of a system, modeling actions, states, and operations over time:
7. Activity Diagram: Models step-by-step control and data flows (similar to flowcharts).
8. State Diagram: Illustrates the lifecycle transitions of a single object state.
9. Use Case Diagram: Shows system requirements, user roles (actors), and core actions.
3.3 Interaction Diagrams
Interaction diagrams are a specialized subset of behavioral diagrams that depict direct communication between objects and the chronological flow of data:
10. Sequence Diagram: Chronologically traces messages exchanged between objects.
11. Communication Diagram: Focuses on structural organization of objects that exchange messages.
12. Interaction Overview Diagram: High-level view combining activity and sequence nodes.
13. Timing Diagram: Traces states and timing constraints of objects over time.
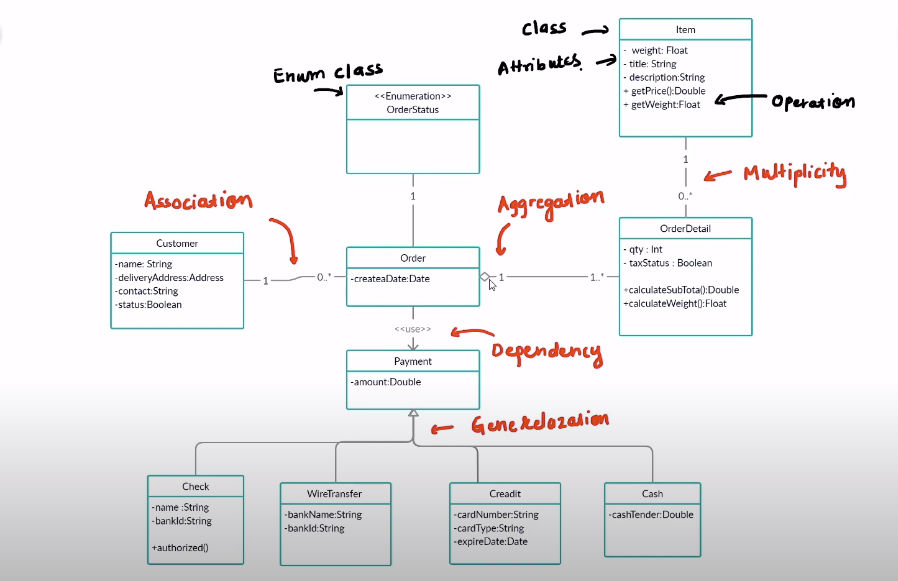
4. Class Diagram
Class diagrams
serve as the absolute backbone of object-oriented modeling and Low-Level Design (LLD). They describe the static structure of a system by showing its classes, attributes, operations (methods), and their relationships between each other.
[!NOTE] Class diagrams describe the compile-time, logical design of a system. To see database layouts, refer to Entity Relationship Diagrams (ERD) .
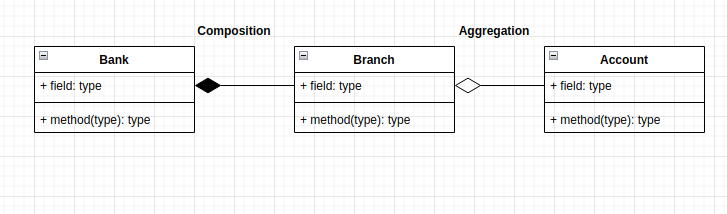
4.1 Composition vs. Aggregation
Both concepts represent “HAS-A” relationships, but they differ significantly in structural ownership and lifecycle dependency:
- Composition (Strong Ownership): The child object cannot exist independently of the parent object. If the parent is destroyed, the child is destroyed too.
- Example: No existence of a
Branchwithout a parentBank.
- Example: No existence of a
- Aggregation (Weak Ownership): The child object can exist independently of the parent. If the parent is destroyed, the child remains intact.
- Example: An
Accountcan exist independently of a singleBranch(it can be transferred elsewhere).
- Example: An
4.2 Generalization (Inheritance)
Generalization represents an is-a relationship and follows a bottom-up approach. It links a specialized class to its general parent class.
- Example:
HondaandToyotaare specialized versions of the general classCar.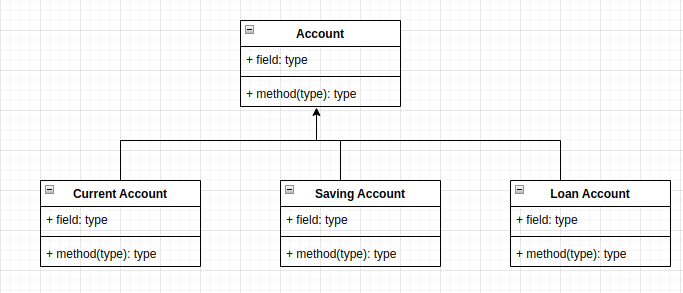
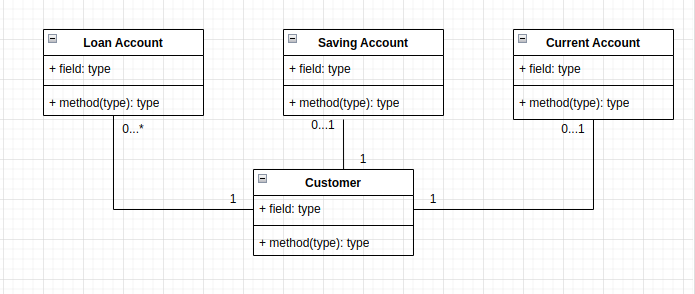
4.3 Multiplicity
Multiplicity specifies the cardinality bounds (how many instances) allowed in a relationship:
1 - 0...*: OneCustomercan have zero or many (*)Loan Accounts.1 - 0...1: OneCustomercan have zero or oneSavings Account.1 - 0...1: OneCustomercan have zero or oneCurrent Account.
4.4 Dependency
Dependency is represented by a dashed arrow pointing from the dependent element to the independent element. It indicates that a change in the independent class may force changes in the dependent class.
- Example:
Net Bankingis dependent onAccount.
4.5 Ancillary Structural Diagrams
- Package Diagrams: A subset of class diagrams, package diagrams organize classes into high-level modules to manage structural namespaces and minimize subsystem dependencies.
- Object Diagrams: Snapshot of static relationships at a particular moment in time, often used to validate complex class diagrams under real scenario values.
- Composite Structure Diagrams: Zoom in on the internal runtime composition of a single class or classifier.
5. Use Case Diagram
Use case diagrams model system functionality from the perspective of external actors (e.g. users, systems, or timers) interacting with the system boundary.
5.1 Extend vs. Include Relationships
- Extend Relationship (
<<extend>>): The extended use case is optional and is executed only under specific conditions after the base use case completes. The dashed arrow points backwards toward the base use case. - Include Relationship (
<<include>>): The included use case is mandatory and forms a core part of the base use case. The dashed arrow points forward toward the included use case.

6. State Diagram
State diagrams (also known as state machine diagrams) model the lifecycle behavior of a single object by tracking its states and transitions in response to events.
- States: Represent conditions or situations in the lifecycle of an object (e.g.
Idle,Connecting,Terminated). - Transitions: Directed arrows depicting the movement of an object between states.
- Events: Triggers or inputs that cause state transitions.
7. Activity Diagram
Activity diagrams describe step-by-step procedural workflows, focusing on concurrency, control decisions, and data synchronization across systems.
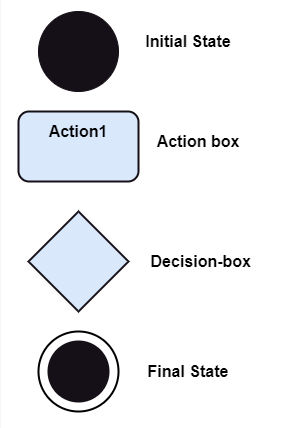
7.1 Core Components
- Initial State: A filled circle depicting the
beginningof a set of actions. - Final State: A bulls-eye circle representing the
endingof all flows. - Decision Box: A diamond-shaped box used to route control flows down a single path based on conditional guards.
- Action Box: Rounded rectangles representing atomic
actionsthat must be executed.
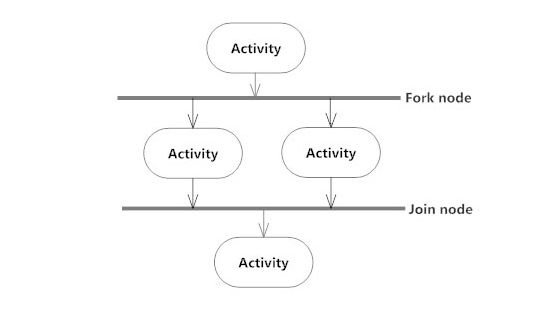
7.2 Synchronization (Fork & Join)
Fork and Join nodes manage concurrent execution paths within a workflow:
- Fork Node: Splits a single incoming control flow into multiple concurrent parallel branches.
- Join Node: Re-combines multiple concurrent parallel flows back into a single outgoing path.

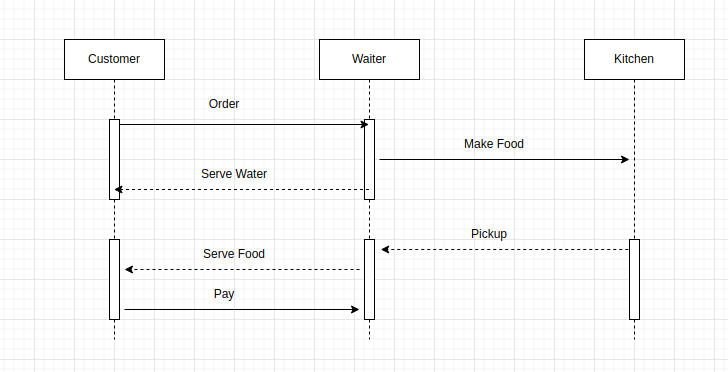
8. Sequence Diagram
Sequence diagrams model the dynamic interactions between objects by mapping out messages chronologically.
- Call/Request Message: Depicted by a solid line with a solid arrow head.
- Return/Response Message: Depicted by a dashed line with an open arrow head.
9. UML vs. ERD
UML and Entity Relationship Diagrams (ERDs) serve different but complementary purposes during system planning:
| Metric | Unified Modeling Language (UML) | Entity Relationship Diagram (ERD) |
|---|---|---|
| Primary Scope | Visualizing and planning the structural and behavioral logic of a software system. | Visualizing and mapping out logical or physical entities in a database. |
| Focus Area | Broad: plans software architectures, behavior, states, and sequential runtime messages. | Narrow: structures tables, constraints, fields, keys, and schemas. |
| Implementation | Comprises a family of 13 diagram types (static and dynamic). | A single, specific diagram type focused on entities and relations. |
| Object Orientation | Tailored for object-oriented systems (classes, inheritance, polymorphism). | Designed for relational databases (tables, primary/foreign keys). |
10. References & Further Reading
- Tutorial Series: UML & Design Patterns Video Course
- Design Guides: Guru99 UML Class Diagrams
- Diagramming Reference: Entity Relationship Diagram Guide