# Topic covered
* UML, Its Benefits
* Types of UML Diagrams
  * Structural UML diagrams
  * Behavioral UML diagrams
  * Interaction Diagrams
A Unified Modeling Language (UML) diagram provides a visual representation of an aspect of a system.
UML diagrams illustrate the quantifiable aspects of a system that can be described visually, such as relationships, behavior, structure, and functionality.
The original UML specified nine diagrams; UML 2.x brings that number up to 13.
Benefits of using UML
- Develop a
quick understandingof a software Breaks complex systeminto desecrate pieces.Graphical notationscan be used to communicate design decisions.
Types of UML Diagrams
The current UML standards call for 13 different types of diagrams
Structural UML diagrams
- Structural diagrams
focus on static aspectsof a system.
1. Class diagram
2. Package diagram
3. Object diagram
4. Component diagram
5. Composite structure diagram
6. Deployment diagram
Behavioral UML diagrams
- Behavioral diagrams
focus on dynamic aspectsof a system. - Action that we perform in the system
7. Activity diagram
8. State diagram
9. Use case diagram
Interaction Diagrams
It is a subset of behavioral diagrams. It depicts the interaction between two objects and the data flow between them
10. Sequence diagram
11. Communication diagram
12. Interaction overview diagram
13. Timing diagram
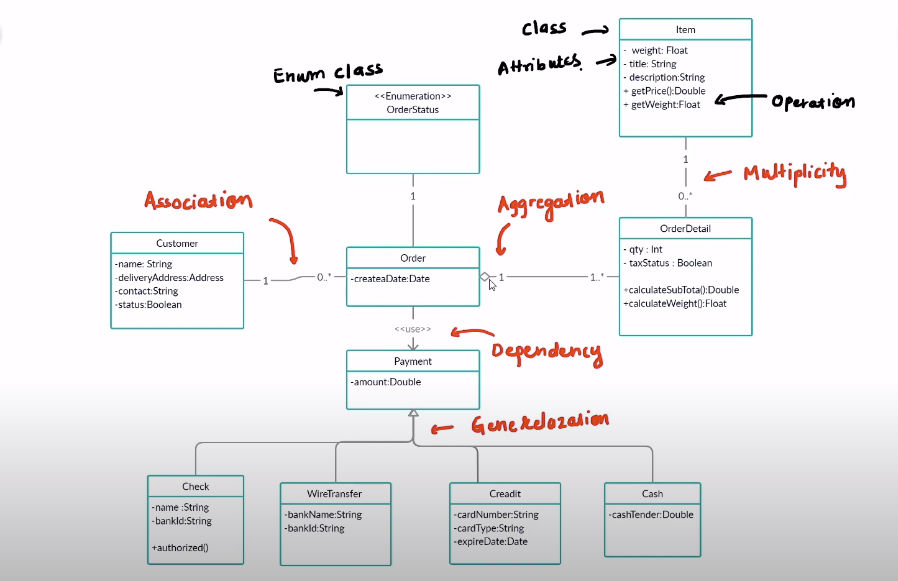
Class diagram
https://www.guru99.com/uml-class-diagram.html
https://www.smartdraw.com/class-diagram/
Reference: /tags/erd/
Class diagrams are the backbone of almost every object-oriented method, including UML. They describe the static structure of a system.
It gives an overview of a software system by displaying classes, attributes, operations, and their relationships between each other.
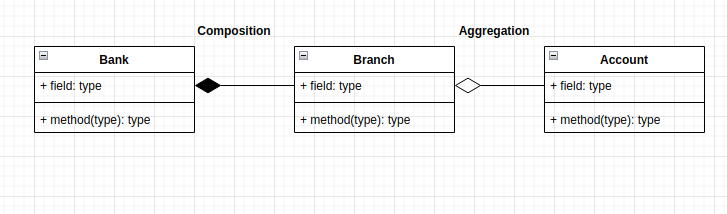
Composition and Aggregation
Composition: Has strong ownership between two classes, No existence of Branch without Bank
Aggregation: Account can exist without Branch (a/c can be moved to other branch if current is deleted)
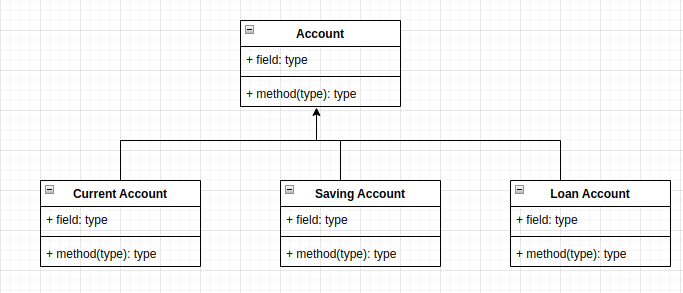
Generalization
Generalization is another name for inheritance or an is a relationship. It is a Bottom-up approach.
It refers to a relationship between two classes where one class is a specialized version of another.
For example, Honda, Toyota are type of car. So the class Honda, Toyota would have a generalization relationship with the class car.
Multiplicity
1 - 0...*- 1 Customer can have 0 or any no of Loan Account1 - 0...1- 1 Customer can have 0 or 1 no of Saving Account1 - 0...1- 1 Customer can have 0 or 1 no of Current Account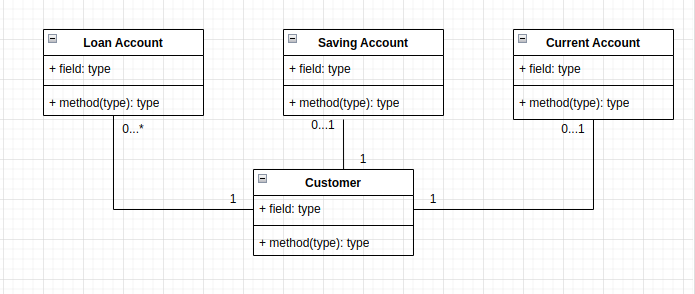
Dependency
Dependency is represented by a dotted arrow as shown in the following figure. The arrow head represents the independent element and the other end represents the dependent element.
A dependency means the relation between two or more classes in which a change in one may force changes in the other.
- Net Banking is depended on Account

More Diagram
Package diagrams are a subset of class diagrams, but developers sometimes treat them as a separate technique.
Package diagrams organize elements of a system into related groups to minimize dependencies between packages.
Object diagrams describe the static structure of a system at a particular time.
They can be used to test class diagrams for accuracy.
Composite structure diagrams show the internal part of a class.
Use Case Diagram
https://www.smartdraw.com/use-case-diagram/
A use case diagram is a dynamic or behavior diagram in UML. Use case diagrams model the functionality of a system using actors and use cases.
Use cases are a set of actions, services, and functions that the system needs to perform
Use Case Relationship
To represent complex relationships between different use cases, we can use the extend and include relationships.
Extend relationship: The use case is optional and comes after the base use case.
It is represented by a dashed arrow in the direction of the base use case with the notation «extend».
Include relationship: The use case is mandatory and part of the base use case.
It is represented by a dashed arrow in the direction of the included use case with the notation «include».

State Diagram
AKA state machine diagram, are drawn for a single class to show the lifetime behavior of a single object.
A state chart diagram consists of states, transitions, and events.
States represent the different states of an object or system, transitions represent the movement from one state to another,
and events represent the triggers that cause the system to change state.
Activity diagram
https://www.smartdraw.com/activity-diagram/
https://www.javatpoint.com/uml-activity-diagram
Activity diagrams describe activities which involve concurrency and synchronization, which are a variation of state diagrams that focuses on the flow of actions and events.
An activity diagram consists of activities, actions, and transitions
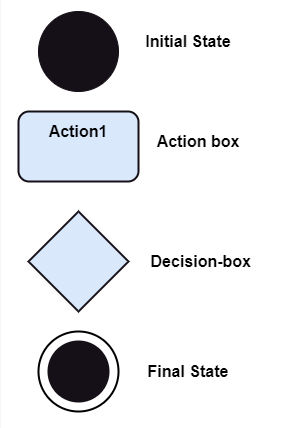
Initial State: It depicts the initial stage or beginning of the set of actions.
Final State: It is the stage where all the control flows and object flows end.
Decision Box: When we need to make a decision before deciding the flow of control, we use the decision box.
It makes sure that the control flow or object flow will follow only one path.
Action Box: It represents the set of actions that are to be performed.
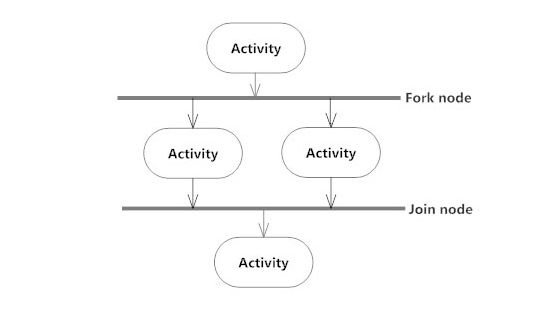
A fork node is used to split a single incoming flow into multiple concurrent flows.
A join node joins multiple concurrent flows back into a single outgoing flow.
A fork and join mode used together are often referred to as synchronization.

Sequence Diagram
https://www.smartdraw.com/sequence-diagram/
https://www.javatpoint.com/uml-sequence-diagram
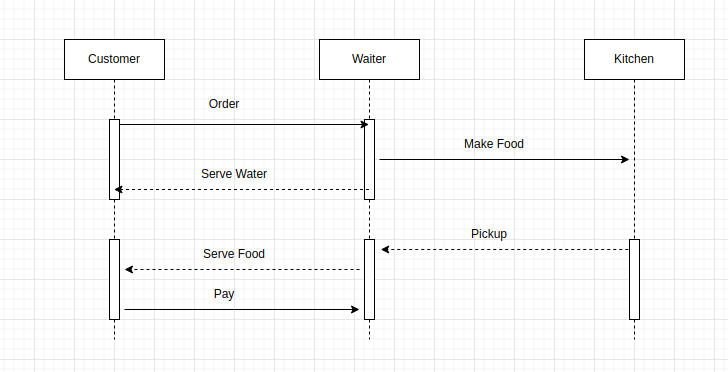
Sequence diagrams describe interactions among classes in terms of an exchange of messages over time.
They’re also called event diagrams.
A sequence diagram is a good way to visualize and validate various runtime scenarios.
These can help to predict how a system will behave and to discover responsibilities a class may need to have in the process of modeling a new system.
Call/Request Message: It is shown by solid line
Return/Response Message: It is shown by doted line
UML vs ERD
SNC: Entity Relationship Diagram
UML and ERDs are both used by software developers to map out software systems and databases before any actual coding occurs. Making a diagram beforehand helps developers see what components are needed, and how the system or database will be structured.
The main difference between UML and ER diagrams is that UML is a language used to create diagrams, whereas ERDs are a type of diagram.
UML is a series of symbols and shapes that help to visualize how software systems are organized, and ERDs show the relationships of entities within databases. Both are able to be read by anyone with relative ease.
UML is used for planning software development, and is used in many different diagrams for various purposes. ER diagrams do not focus on the software, but rather the modelling of databases, which are usually part of a software system.
UML diagrams are broader, and have many uses, and ERDs only have one purpose.