Missing Values
Missing values occurs in dataset when some of the informations is not stored for a variable.
There are 3 mechanisms
- Missing Completely at Random, MCAR
- Missing at Random MAR
- Missing data not at random (MNAR)
1 Missing Completely at Random (MCAR)
Missing completely at random (MCAR) is a type of missing data mechanism in which the probability of a value being missing is unrelated to both the observed data and the missing data. In other words, if the data is MCAR, the missing values are randomly distributed throughout the dataset, and there is no systematic reason for why they are missing.
For example, in a survey about the prevalence of a certain disease, the missing data might be MCAR if the survey participants with missing values for certain questions were selected randomly and their missing responses are not related to their disease status or any other variables measured in the survey.
2. Missing at Random (MAR)
Missing at Random (MAR) is a type of missing data mechanism in which the probability of a value being missing depends only on the observed data, but not on the missing data itself. In other words, if the data is MAR, the missing values are systematically related to the observed data, but not to the missing data.
Here are a few examples of missing at random:
Income data: Suppose you are collecting income data from a group of people, but some participants choose not to report their income. If the decision to report or not report income is related to the participant’s age or gender, but not to their income level, then the data is missing at random.
Medical data: Suppose you are collecting medical data on patients, including their blood pressure, but some patients do not report their blood pressure. If the patients who do not report their blood pressure are more likely to be younger or have healthier lifestyles, but the missingness is not related to their actual blood pressure values, then the data is missing at random.
3. Missing data not at random (MNAR)
It is a type of missing data mechanism where the probability of missing values depends on the value of the missing data itself. In other words, if the data is MNAR, the missingness is not random and is dependent on unobserved or unmeasured factors that are associated with the missing values.
For example, suppose you are collecting data on the income and job satisfaction of employees in a company. If employees who are less satisfied with their jobs are more likely to refuse to report their income, then the data is not missing at random. In this case, the missingness is dependent on job satisfaction, which is not directly observed or measured.
Imputation Missing Values
- Mean Value Imputation
- Median Value Imputation - If we have outliers in the dataset
- Mode Imputation Technqiue - If categorical values
Handling Imbalanced Dataset
Data imbalance usually reflects an unequal distribution of classes within a dataset.
For example, in a credit card fraud detection dataset, most of the credit card transactions are not fraud and a very few classes are fraud transactions.
This leaves us with something like 50:1 ratio between the fraud and non-fraud classes.
1- Resampling (Oversampling and Undersampling)
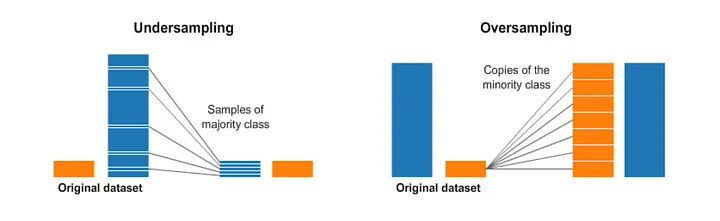
Undersampling / Down-sampling is the process where you randomly delete some of the observations from the majority class in order to match the numbers with the minority class.
Oversampling / Up-sampling is the process of generating synthetic data that tries to randomly generate a sample of the attributes from observations in the minority class. This process is a little more complicated than undersampling.
SMOTE(Synthetic Minority Over-sampling Technique)
SMOTE (Synthetic Minority Over-sampling Technique) is a technique used in machine learning to address imbalanced datasets where the minority class has significantly fewer instances than the majority class. SMOTE involves generating synthetic instances of the minority class by interpolating between existing instances.
In simple terms, it looks at the feature space for the minority class data points and considers its k nearest neighbours.
Data Interpolation
Having lesser dataset and creating datapoints artificially
Data interpolation is the process of estimating unknown values within a dataset based on the known values.
In Python, there are various libraries available that can be used for data interpolation, such as NumPy, SciPy, and Pandas.
Here is an example of how to perform data interpolation using the NumPy library:
- Linear Interpolation
- Cubic Interpolation With Scipy
- Polynomial Interpolation
Linear Interpolation
Feature Extraction
Feature Extraction is a process of selecting and extracting the most important features from raw data.
-
Feature Scaling
- Standardization and SND
- Normalization
- Unit Vector
-
Feature Selection - We just pick the most important feature
- Filter Method
- Embeded Method
- Wrapper Method
-
PCA (Principal Component Analysis) - Any dimension to 1 dimension *